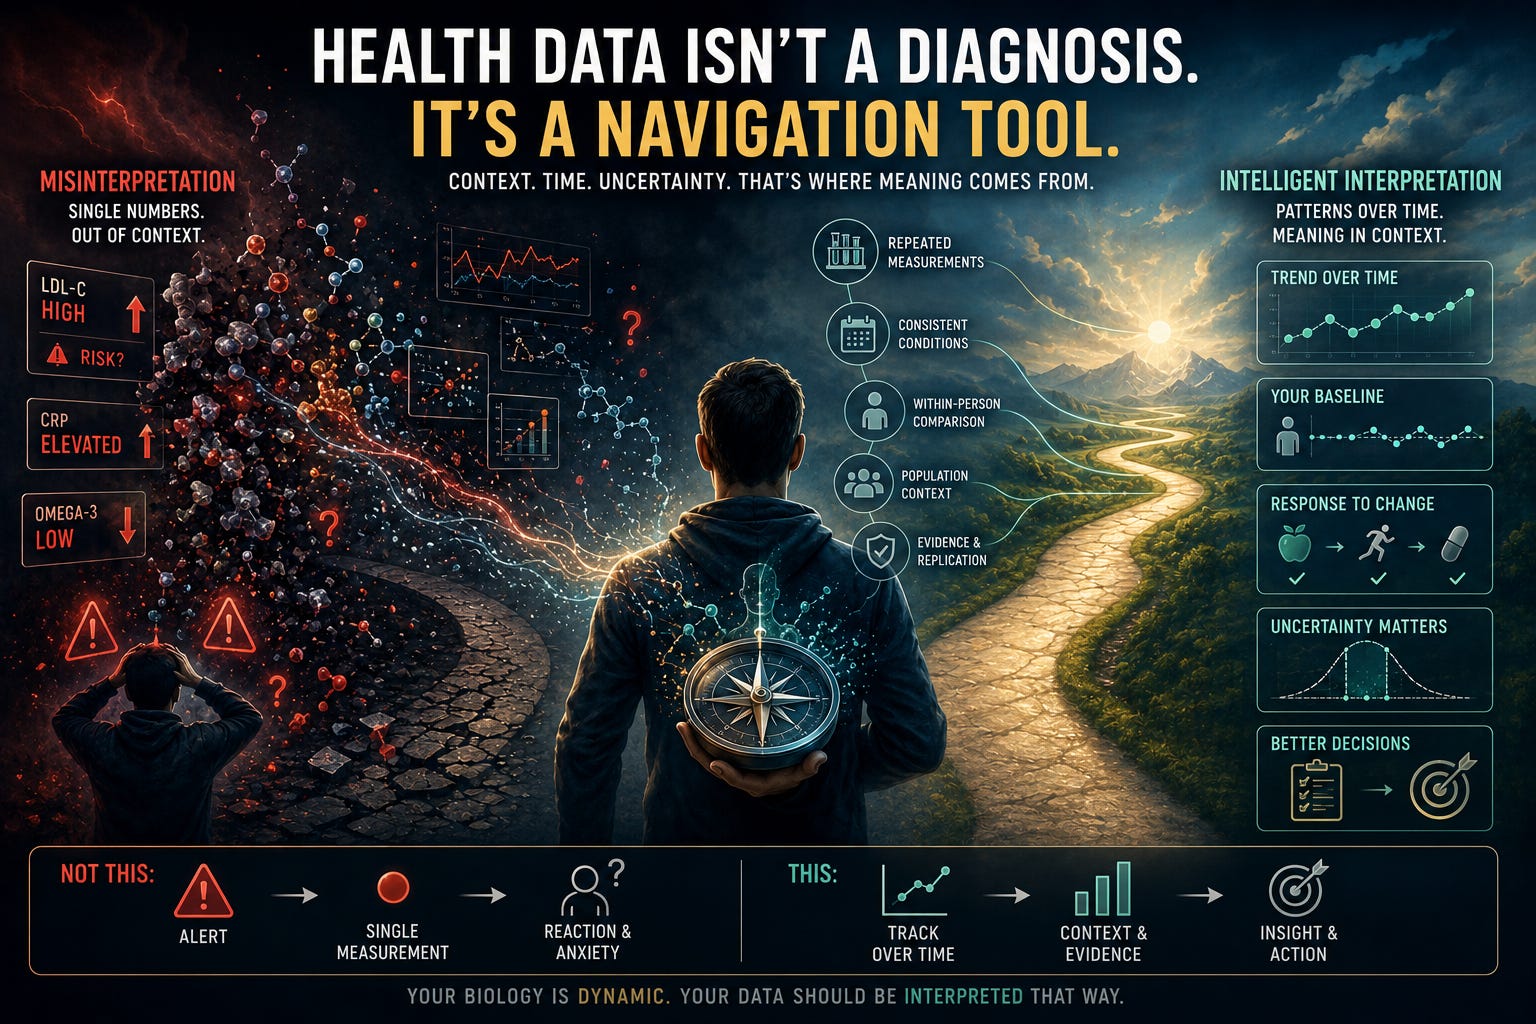
Part One showed why the biomarker pipeline is designed to reward discovery, not validation. Part Two showed what that failure looks like inside the wellness report you hold. Part Three showed which applications have cleared that bar — and what the conditions were. This piece is different. It’s not about what the field gets wrong, or even what it gets right. It’s about what to do with that knowledge — if you’re the person at the other end of the data.
You get a biomarker report. A number is flagged. A recommendation appears.
You stare at it for a moment and wonder: is this telling me something real about my biology — or is it just uncertainty, dressed up with better design?
That question is worth sitting with. And the fact that you’re asking it isn’t a failure of understanding — it’s the right response. Most reports aren’t designed to make the answer obvious. The uncertainty is real. What matters is what you do with it.
The instinct behind advanced health testing is correct: you are not an average, and population averages don’t capture your biology. The question isn’t whether this kind of data is worth having. It’s whether you’re using it in a way that matches what it can actually tell you.
This piece is a set of questions. Not a checklist. Not a verdict on any platform or test. The goal is to leave you better equipped to work with whatever data you’re already generating — and more curious than when you started.
The forecast problem
Weather forecasters used to say: “It will rain tomorrow.”
They don’t anymore. They say: “70% chance of rain.”
The shift wasn’t semantic. It was a reckoning with what the science could honestly deliver — and a recognition that calibrated uncertainty is more useful than false precision. If you pack an umbrella based on “70% chance,” and it doesn’t rain, you weren’t given bad information. You were given accurate probability, and you acted on it reasonably. That’s the model working.
Most biomarker reports haven’t made that shift. The language still reads like certainty: your levels are elevated, consider adjusting, this marker suggests risk. What’s missing is the probability: how strong is the signal? How well-replicated is this association? How much biological variation is expected from week to week even without any intervention?
That’s not a failure of the technology. It’s a communication choice. And once you know to look for it, the absence of uncertainty language is itself information.
When you see a result that says elevated rather than elevated in X% of people who later developed Y, validated across Z independent cohorts, ask yourself which version you’re looking at. The honest one looks like a weather forecast. The less honest one sounds like a diagnosis.
What the data can tell you — and what it can’t
Two types of claims run through most wellness panels. Knowing which one you’re looking at changes everything about how you use the result.
The first: what your body is doing right now. How your lipid profile is responding to a dietary change you made three months ago. Whether your omega-3 status is moving in the direction you expect. How your metabolic markers shifted after six weeks of structured training. These are functional readouts — biological snapshots of your current state in response to your current choices. They’re most useful when tracked over time, in response to a deliberate, specific intervention.
The second: where your body is headed. Cardiovascular risk estimates. Metabolic trajectory predictions. These are predictive claims — statements about future outcomes based on population-level data. They require a different, more demanding evidence base: large longitudinal cohorts, independent replication, consistent effect sizes across diverse populations.
Both can be valuable. Most panels don’t clearly tell you which one they’re delivering.
A good rule of thumb: if the marker is described as something that responds to a behavior — diet, supplementation, training, sleep — you’re likely looking at a functional readout. If it’s described as something that predicts a future outcome, look for the evidence behind the prediction. Not the association — the validated prediction.
The case for within-person tracking
Here’s something the aggregate data makes clear: individual biological variation is far larger than most people expect.
In a study published in Cell, researchers fitted 800 people with continuous glucose monitors and fed them identical standardized meals. Blood glucose responses varied so dramatically across individuals — the same food producing wildly different metabolic reactions in different people — that the authors could build a personalized prediction model using each person’s gut microbiome composition.¹ Same food. Same controlled conditions. Profoundly different biology.
What this means for your data: a single population reference range may tell you very little about where your biology sits, or where it’s headed. The more informative comparison is you versus you — your marker at baseline versus after a specific change, under consistent measurement conditions, tracked long enough to separate biological signal from noise.
This is also where within-person and population-level data become complementary rather than competing. Within-person tracking answers: is my biology changing in response to X? Population data answers a different question: is my response typical, or am I an outlier worth investigating? Both are useful. But the within-person trajectory comes first — you need your own baseline before population context becomes interpretable.
Consumer omics tools are unusually well-positioned to deliver this kind of longitudinal design. Most clinical tools weren’t built for repeated personal measurement. If you’re using advanced health testing, this is the architecture that makes the data most useful — and it requires deliberate planning to execute well.
What that looks like in practice
Consider someone who starts an omega-3 supplementation protocol and retests their omega-3 index four weeks later. The number has barely moved. The obvious conclusion: the intervention isn’t working.
But the omega-3 index reflects fatty acid incorporation into red blood cell membranes — a process that unfolds over weeks to months, and one whose minimum detectable timeframe above measurement noise hasn’t been clearly established in the literature. Without knowing the biological window of the marker you’re tracking, a stable early result looks like failure. With that knowledge, the same result is expected — and the decision to retest at a more appropriate timeframe becomes the difference between an abandoned experiment and a useful one.
This is the framework in miniature. Not a prescription. Just a clearer set of questions to bring to the data.
A framework for making measurements interpretable
The goal isn’t to become your own clinical trial. It’s to ask the kinds of questions that turn a number into something you can actually use — rather than something that sits in an app, looking precise, generating uncertainty without resolving it.
1. Is this marker sensitive enough to measure what I care about?
Not all markers respond to all interventions, and not all respond at the same rate. Before tracking something, check whether it has been shown to respond to the specific behavior you’re changing — and whether the expected magnitude of response is larger than typical measurement noise. If the signal you’re expecting is smaller than the analytical variability of the test, you won’t be able to see it.
TMAO (Trimethylamine N-oxide) serves as a clear example of a responsive functional readout. Plasma levels rise predictably within hours of dietary phosphatidylcholine ingestion, fall when intestinal microbiota is suppressed with antibiotics, and return after antibiotic withdrawal.²·³ That responsiveness — specifically as a marker of dietary and microbiome activity — is documented and experimentally confirmed in humans. The association between circulating TMAO and cardiovascular risk has a separate and more contested evidence base, with causation established primarily in animal models; the human data shows association, not the same mechanistic confirmation. Many markers on wellness panels haven’t been characterized to that level. Knowing which category you’re dealing with is the first question worth asking.
2. Does the pattern hold when you remove the intervention?
One of the most robust methods for verifying a biological response is the A-B-A design: measure at baseline (A), introduce the change and measure again (B), remove the change and observe whether the marker returns toward baseline (A). This isn’t always practical, but when it is, it’s the most robust confirmation that the marker is tracking what you think it’s tracking — not some other change that happened in parallel. The TMAO antibiotic studies are essentially A-B-A designs run in research settings. The logic scales to personal use.
3. Have you accounted for biological lag?
Different markers operate on different timescales. Metabolomic markers can shift within hours of a dietary change. Proteomic markers may take days to weeks. HbA1c — one of the most widely used markers in clinical medicine — reflects average blood glucose over the preceding two to three months, a window determined by the average lifespan of red blood cells (~90-120 days), because it measures the gradual, cumulative attachment of glucose to hemoglobin across that lifespan. Testing your HbA1c two weeks after changing your diet tells you almost nothing about your current glycemic control. The window hasn’t opened yet.
The omega-3 index follows a similar biological logic — fatty acid incorporation into red blood cell membranes is a gradual process, and the dose-response relationship has been well characterized at the level of steady-state outcomes.⁵·⁶ The exact timeframe required for a supplement to move the Omega-3 Index above baseline noise remains a subject of ongoing research.
The window matters. Knowing it prevents you from drawing the wrong conclusion at the wrong moment.
4. Is the measurement environment controlled?
Technical variation follows your sample. Time of day, fasted versus fed state, recent exercise, hydration, and how the sample was processed all affect measurement, with specific lipid and metabolite species particularly vulnerable to degradation under routine handling conditions.⁴·⁷ If any of these vary across measurements, you’re tracking a mix of biology and logistics. The most useful practice: same lab, same time of day, same pre-measurement conditions, documented context for every time point. When something looks like a change, you want to know whether the conditions were consistent enough to trust it.
5. Are you building personal reference ranges — not just using population ones?
Population norms tell you where you sit relative to an average. They don’t tell you what’s normal for your biology, or what a meaningful change looks like for you specifically. Establishing your own baseline variability — through repeated measurements under consistent conditions before any intervention — is what turns a population reference range into something personally interpretable. A marker that fluctuates ±15% at a stable baseline requires a much larger observed change before it means anything than one that fluctuates at ±5%.
6. Are you testing a specific hypothesis — or collecting data?
Without a specific question, more data often creates more confusion — not more clarity. Tracking 50 markers without a hypothesis recreates the discovery problem in miniature: generating associations between your data and your outcomes without the architecture to know whether they’re signal or noise. The most defensible personal measurement strategy picks a small number of markers tied to a specific, plausible biological question — I’m changing X. Does marker Y respond? The narrower the question, the more interpretable the answer.
What this means in practice
Imperfect measurements are not useless measurements. Clinical medicine has always operated under uncertainty — the question is never whether the data is perfect, but whether its limitations are understood well enough to interpret it responsibly. A marker that isn’t ready to predict your ten-year cardiovascular risk can still tell you something true and actionable about your biology today.
None of this is an argument against testing. It’s an argument for the kind of testing that can actually tell you something.
The same qualities that make a biomarker credible in research — pre-specified hypotheses, controlled conditions, longitudinal design, explicit acknowledgment of what the measurement can and cannot detect — also make personal tracking more useful. The framework scales down.
If you’re working with a practitioner who uses advanced omics testing, these questions are worth asking together: What exactly is this marker measuring? What evidence supports using it this way? How stable is it in the absence of intervention? What would a meaningful change actually look like? Those aren’t gotcha questions. They’re the ones the good practitioners are already asking.
The data you’re generating about your own biology is genuinely interesting. The instinct behind wanting more of it — wanting to know how your system works, not just how it compares — is scientifically well-placed. The field is building the infrastructure to answer those questions with the confidence they deserve.
In the meantime, the right tools are curiosity, precision, and honest calibration.
Not a checklist. A better set of questions to sit with.
Part Five closes the series with a field-level map: what’s validated, what’s emerging, and what’s being oversold — a reference piece designed to be bookmarked and returned to as the science evolves.
José Carlos Bozelli Jr., PhD, is a lipid biochemist, omics data scientist, and scientific writer. He advises biotech, CRO, and health-tech teams on lipidomics, large-scale omics data pipelines, and biomarker science — and translates complex molecular data into decisions for scientists, clinicians, and builders.
The content of this article is for informational and educational purposes only and does not constitute medical advice. Consult a qualified healthcare professional before making decisions based on biomarker results.
References
Zeevi D, et al. Personalized nutrition by prediction of glycemic responses. Cell. 2015;163(5):1079–1094.
Tang WH, et al. Intestinal microbial metabolism of phosphatidylcholine and cardiovascular risk. New England Journal of Medicine. 2013;368(17):1575–1584.
Koeth RA, et al. Intestinal microbiota metabolism of L-carnitine, a nutrient in red meat, promotes atherosclerosis. Nature Medicine. 2013;19(5):576–585.
Sens A, et al. Pre-analytical sample handling standardization for reliable measurement of metabolites and lipids in LC-MS-based clinical research. Journal of Mass Spectrometry and Advances in the Clinical Lab. 2023;9:39–52.
Harris WS, et al. Omega-3 fatty acids in cardiac biopsies from heart transplantation patients: correlation with erythrocytes and response to supplementation. Circulation. 2004;110(22):3350–3355.
Walker RE, et al. Predicting the effects of supplemental EPA and DHA on the omega-3 index. American Journal of Clinical Nutrition. 2019;110(4):1034–1040.
Reis GB, et al. Stability of lipids in plasma and serum: effects of temperature-related storage conditions on the human lipidome. Journal of Mass Spectrometry and Advances in the Clinical Lab. 2021;22:100218.