Most signals don’t become biomarkers. This is what separates those who do.
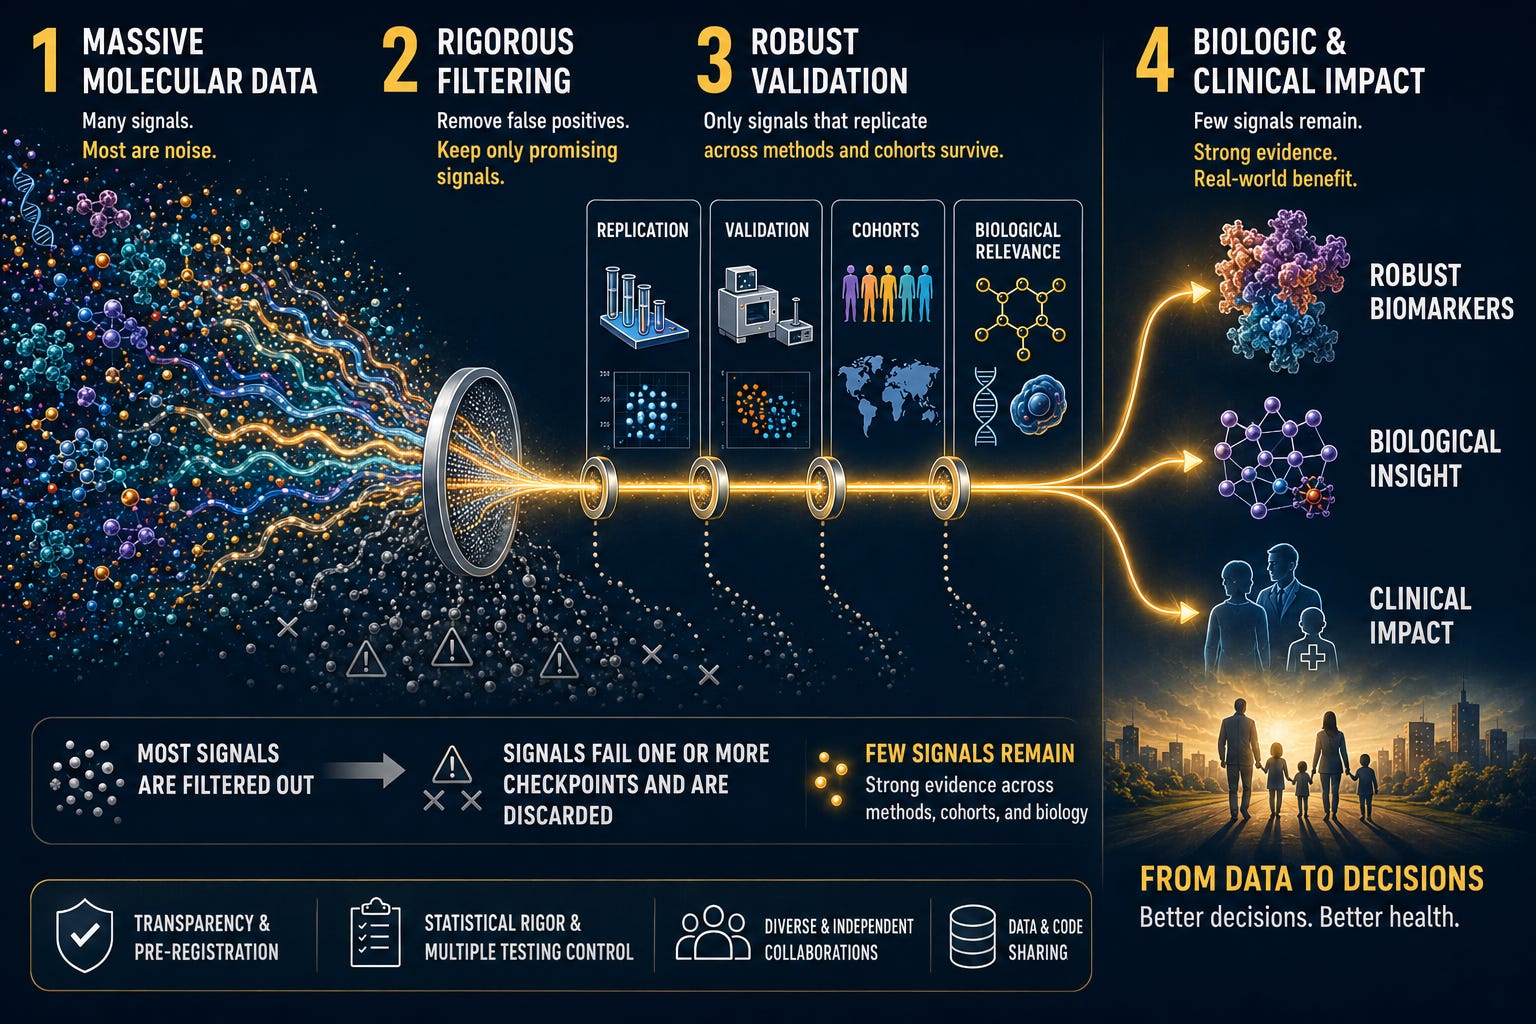
Part One examined why the biomarker pipeline is structurally designed to reward discovery over validation. Part Two showed what that failure looks like inside the report you hold. This piece asks a different question: under what conditions does the science actually work — and how do you recognize those conditions when you see them?
Most discussions about omics ask the wrong question.
They ask whether the field works.
The more useful question is: under what conditions does it work — and how do you recognize those conditions when you see them?
Because the answer is more specific than most people realize. And once you see it, most biomarker claims become immediately easier to evaluate.
Two types of claims run through most omics panels. Some track what is happening now — how your biology is responding to what you are doing. Others estimate where you are headed based on population-level data. Each requires a different evidence base to be credible.
In the wellness and direct-to-consumer (D2C) context, the most defensible near-term applications sit on the functional side — assessing metabolic state, tracking responses to dietary or supplementation interventions, and monitoring physiological change over time. Disease risk prediction, when it appears in this space, requires the same rigorous validation as clinical tools. These are different problems, and understanding the difference is what makes the map useful.
“Omics” is a broad umbrella — genomics, transcriptomics, proteomics, metabolomics, lipidomics, exposomics. This piece focuses on genomics as the clearest historical template, and proteomics, metabolomics, and lipidomics as the fields now building on it.
The precedent: what “mature” actually looks like
Genomics provides the clearest template. Not because it solved everything, but because it faced the same structural problems — and in specific domains, worked through them.
The replication story
TCF7L2 — encoding Transcription Factor 7-Like 2, a protein in the Wnt signaling pathway central to insulin secretion — is among the most consistently replicated findings in the genetics of complex disease, confirmed through a single mechanism: independent groups kept testing it and kept getting the same answer.
The original association with type 2 diabetes was reported in 2006 in an Icelandic population.¹ The same year, an independent group confirmed it in 6,736 UK subjects.² Over the following years, teams in Finland and Sweden³ and Pakistan⁴ found the same signal.
Florez and colleagues demonstrated in the Diabetes Prevention Program — 3,548 participants, prospective design — that carriers of the high-risk genotype were 1.55 times more likely to progress from impaired glucose tolerance to diabetes.⁵
The finding hadn’t changed. The confidence in it had grown.
That is what the validation machinery is supposed to produce.
The translation story
Polygenic risk scores for coronary artery disease (CAD) trace a slower arc — still underway. From a single genome-wide association study (GWAS) locus on chromosome 9p21 in 2007, through 15 years of consortium-scale data aggregation, a multi-ancestry score now identifies 20% of the population at three-fold elevated CAD risk across 1.4 million subjects.⁶ That is a meaningful population-level stratification — and an important caveat travels with it: polygenic risk scores are not genetic predispositions. They are probabilistic risk estimates derived from population-scale associations, not indicators of an individual's fixed biological trajectory.⁷ Researchers are now evaluating whether these scores can effectively guide treatment decisions in primary prevention.⁸
Where generalizability fails
The 9p21 haplotypes that confer cardiovascular risk in European populations are virtually absent in people of African ancestry.⁹ A mature field acknowledges this and builds it into design requirements.
The same infrastructure — independent replication, prospective cohorts, acknowledged limits — is what the broader omics spectrum is now building.
Two tracks. Two evidence bars.
Not all biomarker claims require the same evidence. Functional readouts and predictive claims are different problems requiring different validation architectures.
The predictive track: what validated looks like
Ceramides are the clearest example in lipidomics of a predictive biomarker validated properly.
In 2016, researchers identified specific ceramide ratios — most notably Cer(d18:1/16:0)/Cer(d18:1/24:0) — as having predictive value of cardiovascular death across three independent CAD cohorts.¹⁰ The same year, a population-based cohort study of 8,101 apparently healthy individuals from the FINRISK 2002 cohort confirmed the same species predicted major adverse cardiovascular events over follow-up extending to 2014.¹¹ A ceramide-phospholipid risk score, CERT2 (Cardiovascular Event Risk Test 2), was subsequently validated across three independent cohorts, including nearly 6,000 participants from the LIPID trial.¹²
Not one study. Not one population. The same signal, independently confirmed.
That validation pathway supported the availability of ceramide panel testing as a clinical laboratory service in some European settings. The ceramide case is an exception: it combines independent replication, prospective outcome validation, and standardized targeted measurement — a combination most omics biomarkers have not yet achieved.
Across the broader omics spectrum, proteomics and metabolomics are now undergoing similar large-scale validation and standardization processes. Large-scale protein profiling of UK Biobank participants generates risk scores with models correctly identifying the higher-risk individual in more than 80% of comparisons — for conditions including cancer, dementia, and cardiovascular disease.¹³ That performance was demonstrated through cross-validation within the UK Biobank; external independent validation across separate cohorts remains a necessary next step before clinical application — and the authors state this explicitly, which is itself evidence of a maturing field.
The timeline is not a failure — it is what rigor looks like.
Both proteomics and lipidomics face similar platform standardization and reproducibility challenges. The ceramide story demonstrates what targeted standardization of specific assays can achieve even when broad platform-wide standardization remains incomplete. Build validated, targeted measurement tools for specific applications — one at a time.
The functional track: a different study design, equal rigor
Functional readouts require evidence that a marker reliably responds to the biological process it is intended to reflect — and that the response is distinguishable from measurement noise. This is a different validation question from predicting long-term outcomes across populations. It is not a lower standard. It calls for a different study architecture.
TMAO — trimethylamine N-oxide — illustrates what that validation looks like in practice. This metabolite, measurable by liquid chromatography-mass spectrometry (LC-MS), is produced when gut bacteria metabolize dietary phosphatidylcholine, choline, and L-carnitine — compounds abundant in red meat, eggs, and dairy. In controlled challenge studies, plasma TMAO rises predictably within hours of phosphatidylcholine ingestion, falls when intestinal microbiota is suppressed with antibiotics, and returns when antibiotic treatment is withdrawn.¹⁴ Omnivorous participants produce substantially more TMAO than vegans or vegetarians following L-carnitine ingestion — a diet-microbiome-metabolite chain that is both biologically plausible and experimentally confirmed.¹⁵
The functional readout is validated: alter dietary input, measure plasma TMAO by LC-MS, and observe a predictable, reproducible biological response.
The same molecule also carries a predictive claim — that elevated circulating TMAO is associated with increased cardiovascular risk. That claim has a different and more contested evidence base, with less consistent replication across independent populations. The two uses of TMAO are not interchangeable, and conflating them is exactly the pattern Part Two described. One validates as a functional readout. The other has yet to clear the multi-cohort validation bar that ceramides achieved.
The PREDICT-1 study adds a further dimension to why functional readout design matters. When 1,002 healthy adults consuming identical meals showed postprandial triglyceride responses with a coefficient of variation exceeding 100%, the finding was not simply that people differ.¹⁶ It was that individual responses can vary dramatically even under tightly controlled conditions.
Cross-sectional population studies remain essential for defining distributions, identifying patterns, and enabling stratified comparisons when paired with appropriate metadata. But they describe where individuals sit relative to others — not how their biology changes in response to a specific intervention.
Longitudinal within-person tracking captures what cross-sectional designs cannot: the direction and magnitude of a specific person’s biological response to a specific intervention.
For functional readouts used in D2C tools, that within-person comparison is the one that matters — and it is the design these tools are positioned to deliver at scale.
For those building or investing in this space, the asymmetry is worth naming directly. Most of what is currently being sold as predictive in D2C omics has not met the predictive validation bar — it has met a different one: association in a single cohort, without independent replication across populations and time. The functional readout track, which has a more bounded evidence requirement and maps directly to what individual longitudinal tools can actually deliver, remains underbuilt with rigorously validated products. That gap is the opportunity.
For practitioners interpreting these tools, the distinction is immediately applicable. A marker used to track a patient’s response to a dietary or supplementation protocol needs evidence of responsiveness and measurement stability — the TMAO case provides the model. A marker used to estimate cardiovascular risk needs independent validation across populations and time — the ceramide case provides that model. Most panels do not clearly tell you which standard they have met. Asking is not unreasonable.
What the system requires (for both tracks)
A signal is not a biomarker until it survives validation.
Both tracks rest on the same underlying foundation. Three components apply regardless of which question is being asked:
Standardized platforms with documented performance. Functional and predictive validation alike depend on measurements that behave consistently across sites, operators, and time. The ceramide validation studies used consistent LC-MS methodology across multiple independent research sites — the same analytical approach yielding the same signal in geographically and demographically distinct cohorts. The TMAO challenge studies relied on LC-MS measurements specific enough to detect dietary phosphatidylcholine separately from endogenous choline. Measurement quality is not a distinguishing feature of one track. It is the foundation both tracks require.
Prospective, pre-specified study designs. Hypotheses, cohorts, measurement protocols, and analysis plans defined before examining outcomes. Post-hoc analysis produces associations. Prospective pre-specified testing produces evidence.
Honest uncertainty communication. Knowing what a tool can and cannot say — and stating it clearly — is not a limitation. It is the condition under which the data is usable.
Where the field stands now
Some applications have crossed from promising to credible.
Specific ceramide ratios have cleared multi-cohort validation and entered clinical laboratory practice in some settings. Polygenic risk scores for CAD are being evaluated for their ability to guide clinical decisions in primary prevention. TMAO measurement demonstrates that metabolomics can produce validated functional readouts of dietary exposure and gut microbiome activity when the right study architecture is used.
Mass spectrometry-based metabolite profiling has already demonstrated what deployment at the population scale looks like. Tandem mass spectrometry — introduced to newborn screening programs in the late 1990s and now widely implemented across countries worldwide — enables screening for 40 to 50 inherited metabolic conditions from a single dried blood spot, making it one of the most successful large-scale applications of metabolite profiling in public health practice.17
The question for omics-based health monitoring is not whether this infrastructure can be built — it has been. It is whether the same evidence standards applied in those validated contexts travel into consumer-facing products with the same rigor.
The distance remaining is real. Most omics markers in most wellness panels have not completed the journey these examples have.
The examples in this piece are not anomalies. They are templates. Ceramides, polygenic scores, TMAO as a functional readout: each became credible through the same sequence — pre-specified study design, independent replication, consistent measurement across sites, honest acknowledgment of limits.
That sequence is reproducible. The organizations applying it systematically, rather than claiming validation by proximity to promising findings, are building something durable. The field matures one validated application at a time. These are three of them.
If you are following the series, Part IV moves from infrastructure to application, and what all of this means in practice for the person deciding whether to trust and use these tools.
Scientific note: This article cites peer-reviewed evidence throughout. All references are independently verified. Claims about individual biomarkers are scoped to the published literature cited and do not constitute medical advice.
José Carlos Bozelli Jr., PhD, is a lipid biochemist, omics data scientist, and scientific writer. He advises biotech, CRO, and health-tech teams on lipidomics, large-scale omics data pipelines, and biomarker science — and translates complex molecular data into decisions for scientists, clinicians, and builders.
The content of this article is for informational and educational purposes only and does not constitute medical advice. Consult a qualified healthcare professional before making decisions based on biomarker results.
References
Grant SFA, et al. Variant of transcription factor 7-like 2 gene confers risk of type 2 diabetes. Nature Genetics. 2006;38(3):320–323.
Groves CJ, et al. Association analysis of 6,736 UK subjects provides replication and confirms TCF7L2 as a type 2 diabetes susceptibility gene. Diabetes. 2006;55(12):3640–3644.
Lyssenko V, et al. Mechanisms by which common variants in TCF7L2 increase risk of type 2 diabetes. Journal of Clinical Investigation. 2007;117(8):2155–2163.
Rees SD, et al. Replication of 13 genome-wide association-validated risk variants for type 2 diabetes in Pakistani populations. Diabetologia. 2011;54(6):1368–1374.
Florez JC, et al. TCF7L2 polymorphisms and progression to diabetes in the Diabetes Prevention Program. New England Journal of Medicine. 2006;355(3):241–250.
Patel AP, et al. A multi-ancestry polygenic risk score improves risk prediction for coronary artery disease. Nature Medicine. 2023;29(7):1793–1803.
Furrer RA, Turkheimer EN. Polygenic risk scores are not genetic predispositions. Nature Human Behaviour. 2026. DOI: 10.1038/s41562-026-02475-8.
Marston NA, et al. Predictive utility of a coronary artery disease polygenic risk score in primary prevention. JAMA Cardiology. 2022;7(10):1000–1008.
Tcheandjieu C, et al. Large-scale genome-wide association study of coronary artery disease in genetically diverse populations. Nature Medicine. 2022;28(8):1679–1692.
Laaksonen R, et al. Plasma ceramides predict cardiovascular death in patients with stable coronary artery disease and acute coronary syndromes beyond LDL-cholesterol. European Heart Journal. 2016;37(25):1967–1976.
Havulinna AS, et al. Circulating ceramides predict cardiovascular outcomes in the population-based FINRISK 2002 cohort. Arteriosclerosis, Thrombosis, and Vascular Biology. 2016;36(12):2424–2430.
Hilvo M, et al. Development and validation of a ceramide- and phospholipid-based cardiovascular risk estimation score for coronary artery disease patients. European Heart Journal. 2019;40(24):1964–1975.
You J, et al. Plasma proteomic profiles predict individual future health risk. Nature Communications. 2023;14(1):7817.
Tang WH, et al. Intestinal microbial metabolism of phosphatidylcholine and cardiovascular risk. New England Journal of Medicine. 2013;368(17):1575–1584. DOI: 10.1056/NEJMoa1109400.
Koeth RA, et al. Intestinal microbiota metabolism of L-carnitine, a nutrient in red meat, promotes atherosclerosis. Nature Medicine. 2013;19(5):576–585. DOI: 10.1038/nm.3145.
Berry SE, et al. Human postprandial responses to food and potential for precision nutrition. Nature Medicine. 2020;26(6):964–973.
Loeber JG, et al. Neonatal screening in Europe revisited: an ISNS perspective on the current state and developments since 2010. International Journal of Neonatal Screening. 2021;7(1):15. DOI: 10.3390/ijns7010015 (PMC8006225).