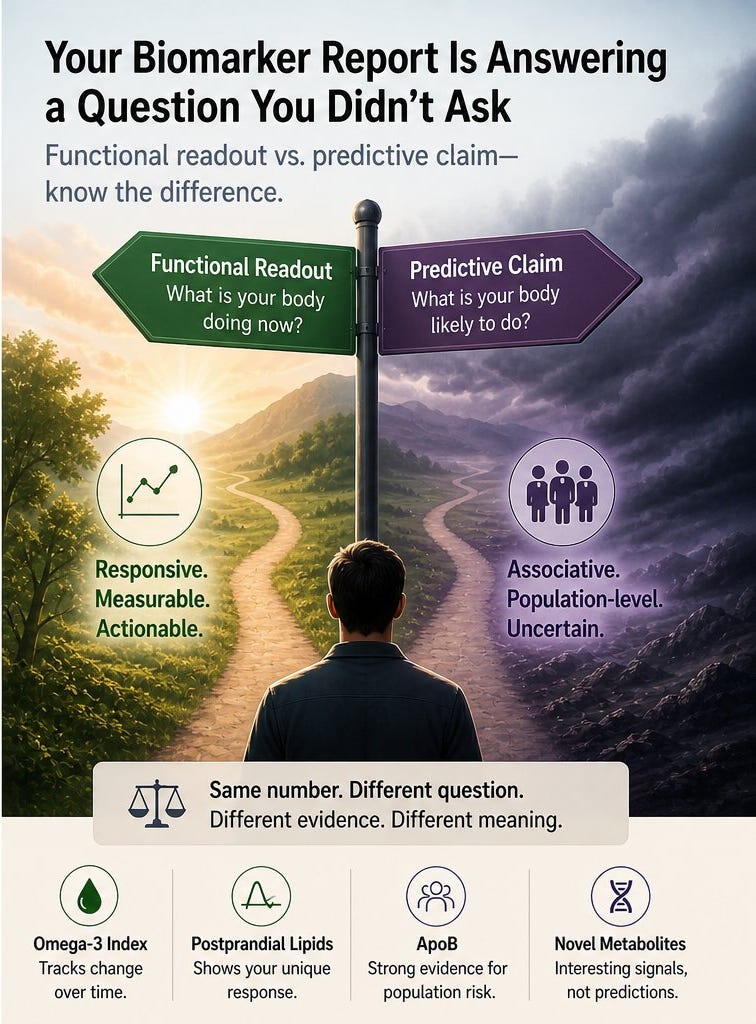
Same number. Different question. Different evidence. Different meaning.
This is Part Two of a series on omics-based biomarkers. Part One — “The Biomarker Gold Rush Has a Counterfeiting Problem” — argues that the pipeline between discovery and clinical use is structurally designed to reward finding candidates, not validating them: a system-level critique written for scientists, developers, and investors. This piece is what that failure looks like from the inside: in the report you hold, in the number you’re trying to interpret, in the recommendation that doesn’t say how much to trust it.
You’ve just opened a detailed wellness report. Hundreds of biomarkers. Color-coded flags. A recommendation that says: Consider adjusting your omega-3 intake.
What it doesn’t say: whether this number is a snapshot of where your body is today, or a signal of where it’s headed in ten years.
Those are two entirely different questions. They require different types of evidence. Most wellness reports are written as if they were the same.
That gap is worth understanding — because it changes everything about how you use the data.
Two questions, one report
Every biomarker on a wellness omics panel is implicitly answering one of two questions. The number looks identical either way. So does the flag.
The first question: what is your body doing right now? Is your fat metabolism responding to the dietary shift you started three months ago? Are your lipid levels responding to the metabolic demands of your current training? Is your omega-3 status moving in response to supplementation? This is a functional readout — a biological snapshot at your current choices and circumstances.
The second question: what is your body likely to do in the future? Are you at elevated risk for cardiovascular disease? Is your metabolic trajectory pointing toward insulin resistance five years from now? These are predictive claims — statements about where you’re headed, not where you stand.
Both types of information can be real and valuable. What separates them is the evidence required to make the claim honestly.
A number can look precise and still be answering the wrong question. This is not a semantic distinction. It determines how much clinical or behavioral weight you should put on a result — and whether acting on it is likely to help you or mislead you.
The case for the functional readout — and why it’s undersold
Here’s what the wellness industry regularly gets backwards: in its enthusiasm for predictive language, it undersells the functional use case — which is often the more honest and more immediately useful framing.
The omega-3 index is a good illustration. This measure — the proportion of eicosapentaenoic acid (EPA) and docosahexaenoic acid (DHA), i.e., essential marine omega-3 fatty acids — responds to dietary intake and supplementation in a reliable, well-characterized way. Seminal work published in Circulation showed that EPA and DHA levels increase proportionally to supplementation and correlate with levels in cardiac tissue — supporting its use as a validated indicator of omega-3 status.¹ A dose-response model built from data across 1,422 individuals confirmed that the index responds predictably to changes in supplementation, with dose, baseline status, and supplement form together explaining a substantial proportion of the variance in response.²
This is a real signal. Tracking it over time, in response to a deliberate intervention, is scientifically defensible.
Or take postprandial lipid responses — how your triglycerides behave in the hours after a meal. In the PREDICT-1 study, 1,002 healthy adults consumed identical meals and showed postprandial triglyceride responses with a population coefficient of variation exceeding 100%.³ The same food. Wildly different biology. Measuring how your lipid profile responds before and after a dietary change gives you something a reference range never could.
The functional framing is not a consolation prize. In many wellness contexts, it’s the most scientifically honest and actionable thing you can say.
The problem isn’t using these markers. It’s when platforms quietly upgrade them — from functional mirror to crystal ball — without flagging the shift.
Why predictive claims are harder than they look
Validated predictive biomarkers exist. Apolipoprotein B (ApoB) is the clearest example in lipid science — a meta-analysis of twelve epidemiological studies involving more than 233,000 subjects established it as a more accurate marker of cardiovascular risk than LDL cholesterol, a finding replicated across large prospective cohorts and clinical trials.⁴ That’s what a predictive claim requires: longitudinal, large-scale, replicated by independent groups, stress-tested across diverse populations.
Most omics markers in wellness panels haven’t been through that process. A 2024 meta-analysis of 244 clinical metabolomics studies found that 72% of the 2,206 metabolites reported as statistically significant were identified by only a single study — and that 85% were likely statistical noise.⁵ Systematic tracking of metabolomic biomarker panels along the full discovery-to-clinic pathway finds that strong initial performance does not reliably translate — in one review of 77 gastrointestinal cancer panels, including 25 with diagnostic accuracy exceeding 90%, all but one remained stalled at discovery and none had reached clinical approval.⁶
This isn’t a scandal. It’s the normal shape of how science progresses — discovery outpaces validation, especially in fields with powerful new measurement tools. The problem emerges when the gap between what’s been found and what’s been proven disappears inside a report dashboard.
The platforms that handle this honestly say: this marker is associated with X in populations like yours. Those that handle it less honestly say: this means you are at elevated risk for X. The wording difference is small. The scientific difference is not.
Association is not a forecast.
A signal is not a biomarker until it survives validation.
The layer most reports don’t show you
Even when a biomarker is biologically meaningful and correctly framed, there’s a third variable most reports never surface: the quality of the measurement itself.
This is usually discussed in the context of biomarker discovery and validation — large studies, controlled datasets, and statistical correction. But those constraints don’t disappear when measurements are packaged into consumer reports. They follow the data.
Omics panels run on mass spectrometers and require careful sample preparation. The same biological sample can yield different numbers depending on when it was processed, on which instrument, and under what conditions. Researchers call this batch effects — systematic technical variation unrelated to your biology.
In a research setting, these effects are modeled, corrected, and explicitly accounted for. In a consumer-facing report, they are almost never visible — but they are still there. A 2024 review in Genome Biology describes them as “notoriously common” and capable of producing misleading conclusions if not properly corrected.⁷
The problem runs deeper than instrument drift. Pre-analytical handling — what happens to your sample between collection and analysis — matters too. Targeted lipidomics and metabolomics profiling show that storage temperature and processing time are among the strongest determinants of data integrity, with specific lipid species particularly vulnerable to distortion under routine conditions.⁸
Lipidomics studies show that storage conditions systematically alter key phospholipid species. For example, phosphatidylcholines can degrade under benchtop conditions via endogenous lipase activity — changes that fall within the same magnitude as the biological signals these panels are designed to detect.⁹
In population-scale lipidomics datasets — thousands of samples across dozens of analytical batches — getting the biology right is only half the challenge. At scale, this means the dataset is learning the experiment — not the biology. The other half is ensuring that what you’re measuring is actually your biology, not an artifact of the instrument, the reagent lot, or the day the sample was run.
If you’re tracking a biomarker over time to monitor an intervention, the measurement has to be stable enough that a real biological change is distinguishable from analytical drift. That’s not guaranteed. It has to be built, tested, and verified — and that process is almost never visible in a consumer report.
What looks like a biological signal may, in part, be a property of how — and when — the measurement was made.
(For a deeper examination of how batch effects corrupt discovery studies at scale — and why computational correction often makes the problem worse, not better — see Part One.)
Three questions worth asking
None of this is an argument against omics-based wellness testing. The science is real. The tools are improving. And the foundational premise — that you are not an average, that population norms don’t capture your biology — is one of the most important ideas reshaping how we think about health.
But knowing how to read the map matters as much as having one.
Is this a functional readout or a predictive claim? Look at the language. “This marker reflects your current metabolic activity” is functional. “Your levels suggest elevated risk for X” is predictive. Each requires a different kind of evidence — and knowing which one you’re looking at determines how much weight to give the result.
What’s the validation evidence for this specific marker, used this way, in people like you? Not omics in general — this marker, this use, replicated by independent groups. Some have it. Many are still building toward it. That’s worth knowing before acting on the result.
What do you know about the measurement quality? Does the platform use reference standards across analytical batches? Has it published anything on inter-batch reproducibility? These aren’t gotcha questions — they’re what separates measurement infrastructure from measurement aspiration.
What the honest version looks like
The science of omics-based personalized health is at a genuine inflection point. Technology has outpaced validation — which is almost always how it goes at the frontier of any useful new field. That’s not a reason for cynicism. It’s a reason for precision.
The honest framing isn’t “our panel tells you everything.” It’s “here’s what this data tells you, at this level of confidence, and here’s what we’re still working to understand.” For the curious, data-literate people who seek out advanced biomarker testing, that kind of transparency doesn’t undermine trust — it builds it.
Go back to your report. The hundreds of biomarkers. The omega-3 index flagged yellow.
That number might be telling you something real and actionable about where your metabolism is right now. It might hint at a risk trajectory worth following up with a clinician. It might be reflecting your biology with precision — or introducing noise from the measurement itself — or some mixture of both.
The question isn’t whether the data is worth having. It’s what kind of question it’s actually answering.
Most biomarker reports don’t fail because the numbers are wrong.
They fail because they don’t tell you what question they’re answering.
Now you know to ask.
Scientific note: This article cites peer-reviewed evidence throughout. All references are independently verified. Claims about individual biomarkers are scoped to the published literature cited and do not constitute medical advice.
José Carlos Bozelli Jr., PhD, is a lipid biochemist, omics data scientist, and scientific writer. He advises biotech, CRO, and health-tech teams on lipidomics, large-scale omics data pipelines, and biomarker science — and translates complex molecular data into decisions for scientists, clinicians, and builders.
The content of this article is for informational and educational purposes only and does not constitute medical advice. Consult a qualified healthcare professional before making decisions based on biomarker results.
References
Harris WS, et al. Omega-3 fatty acids in cardiac biopsies from heart transplantation patients: correlation with erythrocytes and response to supplementation. Circulation. 2004;110(22):3350–3355.
Walker RE, et al. Predicting the effects of supplemental EPA and DHA on the omega-3 index. American Journal of Clinical Nutrition. 2019;110(4):1034–1040.
Berry SE, et al. Human postprandial responses to food and potential for precision nutrition. Nature Medicine. 2020;26(6):964–973.
Sniderman AD, et al. A meta-analysis of low-density lipoprotein cholesterol, non-high-density lipoprotein cholesterol, and apolipoprotein B as markers of cardiovascular risk. Circulation: Cardiovascular Quality and Outcomes. 2011;4(3):337–345.
Cochran D, et al. A reproducibility crisis for clinical metabolomics studies. Trends in Analytical Chemistry. 2024.
Savva KL, et al. Progress with metabolomic blood tests for gastrointestinal cancer diagnosis — an assessment of biomarker translation. Cancer Epidemiology, Biomarkers & Prevention. 2022;31(9):1669–1681.
Yu Y, et al. Assessing and mitigating batch effects in large-scale omics studies. Genome Biology. 2024;25:254.
Sens A, et al. Pre-analytical sample handling standardisation for reliable measurement of metabolites and lipids in LC-MS-based clinical research. Journal of Mass Spectrometry and Advances in the Clinical Lab. 2023;9:39–52.
Reis GB, et al. Stability of lipids in plasma and serum: Effects of temperature-related storage conditions on the human lipidome. Journal of Mass Spectrometry and Advances in the Clinical Lab. 2021;22:100218.